 The 4 levels of the skill matrix
27 Nov 2016
On the first day of XP Days 2016 Benelux, I attended a hands-on session called The 4 levels of the skill matrix. The session was facilitated by Annelies De Meyere and Jeremy Naus, both from Co-Learning. We were split up into teams of about 5 people and the given context was that each team would have to go build the next xpdays website. Our mission during this session was to create a 4-level skill matrix for our team.
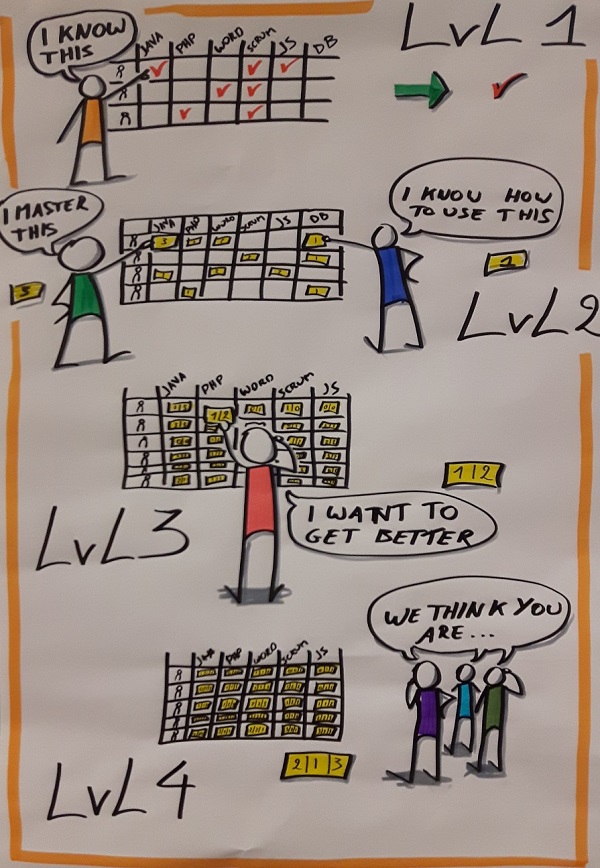
Level 1: skills & team members
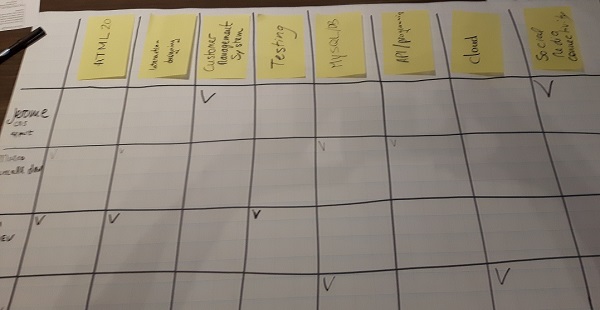
We started off by deciding which 8 skills would be the most important to get the job done. The skills we had to choose were hard skills, but you could also do this for soft skills or even functional domains. We were also given a few predefined roles (e.g. UX designer, DB expert, …) to simplify the exercise. We plotted all the skills and the team members (and their roles) onto a matrix and each team member decided for him/herself whether he/she knew each skill (tickmark top left corner). This already showed us some duplicates and gaps.

I asked Annelies why we had to choose exactly 8 skills. She said this was just to simplify the exercise. She told me she had once done a real skill matrix exercise where they covered 3 entire walls with different skills! It was a matrix for 8 people and it only took about 4 hours to complete (all 4 levels) which might make this exercise quite easy to sell.
Especially if there are a lot of skills, it’s very important to order them by their importance. This will help to visualize which area of the matrix to focus on. But which skill is the most important? Here you could use some variables like the amount of work to be done for a particular skill (backlog).
Level 2: Shu-Ra-Hi
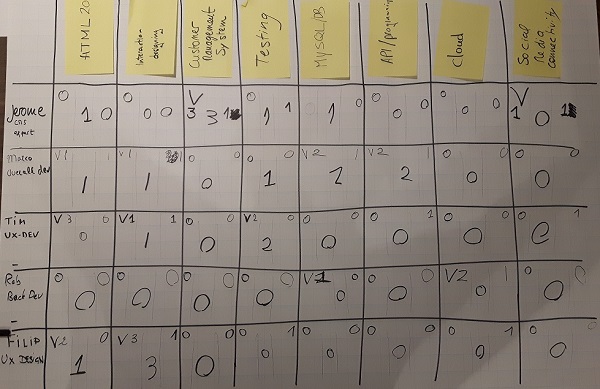
At this point, the level of skill-knowledge was missing in the matrix. After every team member had filled in this new information (top left corner; 0 = no knowledge; 1 = learning; 2 = advanced; 3 = master) it became clear that our previous interpretation about gaps and duplicates was quite off. For example, if only 1 or 2 persons know a certain skill, but their skill level is very low, you could consider this to be a gap…
Level 3: filling the gaps
The next level was about indicating who wanted to learn (or improve) a particular skill. This was achieved by filling in a 0 or a 1 for each skill/person (top right corner). This showed us whether there were long term risks or where we had to take additional actions. For example, there is 1 skill that is mastered by exactly 1 person, and the rest of the team shows no interest in learning this skill. What if this person becomes sick for a long time or leaves the project/company?
Level 4: bring in the team
Sometimes, people think too much / too little of themselves, regarding the mastery of a certain skill. So now it was time to bring in the team and have some discussion about how the team qualifies each person (indicated in the middle). Pro tip: do this planning poker style, to avoid influence by one another. Even better: do this immediately in level 1, so the team doesn’t already know how a particular person rates him/herself.

Taking it further
As the exercise came to an end, my colleague Inge Gorgon from Cegeka took it even further and introduced yet another level. She suggested to indicate whether the people who mastered certain skills, would feel comfortable training other people and whether they were experienced/talented at teaching others. This proves you don’t have to stop at level 4 and you can bring in whathever parameter you find interesting.
Other people were also thinking about how the gaps could be valuable input for a company’s job openings.
Conclusion
The trainers made a nice poster of the 4 levels (clicking it brings you to their website).
This was a nice interactive breakdown about how to set up a skill matrix wich can lead to interesting information about the team (now and in the months/years to come). It looks at skills from the team angle, rather than the career path of an individual. It seems like a good exercise when kicking off a project, but it also may be valuable when you want to plot the functional knowledge in an existing team. If you’re in a company where team members are rotated over different projects, this is a good way to visualize the risk of rotating someone.
